


A zero on the scoreboard can make a routine win memorable. The winning margin might be only one goal, one run or one touchdown, yet the losing side has been denied the most basic reward in sport. Every attacking opportunity has ended in frustration. For the winner, there is satisfaction in something that feels complete.
That feeling crosses sporting boundaries, but the achievement changes dramatically from one game to another. A tennis player who loses a set 6–0 may still have won dozens of points. A hockey goalkeeper can deliver a shutout and finish on the losing side of a shootout. A baseball team can shut out its opponent without any pitcher receiving an individual shutout. Soccer can produce two clean sheets in a single match. Basketball makes a full-game zero so improbable at elite level that a famously poor offensive performance can still include several dozen points.
And yes, a basketball shutout has happened. A Dallas school game in 2009 ended with a reported on-court score of 100–0. It became a controversy about sportsmanship and mismatched competition, rather than a model of defensive excellence. The NBA has never produced a full-game shutout. Its historical low is 18 points, in a game played before the shot clock. Those distinctions matter as much as the headline score. [1, 2, 3]
To understand how hard a shutout really is, we need to ask who was playing, how scoring worked, how long the contest lasted and whose record is being counted. The following comparisons focus mainly on leading professional competitions, with selected international and historical examples. Football includes both the NFL and Canadian football. Records are labelled by competition and format; a Premier League record is not automatically a world soccer record.
What a zero actually means
| Sport | Scoreless achievement | Essential distinction |
|---|---|---|
| Tennis | A bagel is a completed 6–0 set | The opponent can win points while winning no games |
| Ice hockey | No goals conceded during the credited playing time | Team results and individual goalie credit can differ |
| Soccer | A clean sheet is no goals conceded in the match | A 0–0 draw gives both sides a clean sheet |
| Baseball | No opponent runs in the game | A pitcher shutout requires a complete game; teams can combine pitchers |
| Football | No opponent points in the game | Defensive and special-teams scores also break the zero |
| Basketball | No opponent points for an entire game | Documented school examples do not establish an elite professional precedent |
The word “perfect” needs particular care. A clean sheet does not mean the defence allowed no chances. A baseball shutout does not mean no hits, no walks or no errors. A bagel does not mean flawless tennis. These are outcomes, and each can conceal a very different performance beneath the same zero.
There is also a difference between dominance and survival. A soccer goalkeeper might face one comfortable shot in a 3–0 victory. Another might make a series of extraordinary saves to preserve a 0–0 draw. The statistic treats both as one clean sheet, although the individual difficulty was plainly different.
Opportunity matters too. A career total rewards excellence, durability, selection and the strength of the teams around the athlete. A season record depends partly on schedule length. A consecutive streak adds another challenge: one lapse can end weeks of accumulated work. No single column captures all those qualities.
Why repeated chances make zero fragile
Imagine an entirely hypothetical game in which an opponent has ten independent scoring opportunities, each carrying a 10 percent chance of success. The chance of preventing a score on every opportunity is 0.9 multiplied by itself ten times, or about 34.9 percent. Give the opponent 30 such opportunities and the chance falls to about 4.2 percent.
Those are teaching examples, not measured probabilities for any sport. Real possessions are not independent, teams change tactics, and a dangerous chance is not equivalent to a harmless one. Nevertheless, the underlying idea is useful: even a strong defence must keep succeeding, while the opponent needs to succeed only once to erase the shutout.
Tennis provides an especially clear version. In a deliberately simplified model, a player with a 50 percent chance of winning each game would win six consecutive games about 1.6 percent of the time. Raise that assumed game-winning probability to 80 percent and the six-game sweep becomes about 26.2 percent. Neither estimate describes an actual tour match, because serving and returning create different probabilities. The example explains why a large gap in ability can make bagels much more plausible.
Comparisons become misleading when they ignore the denominator. A goalie’s shutouts per appearance cannot be compared directly with a tennis player’s bagels per set. A soccer league has two team opportunities to record a clean sheet in every match. If the result is 0–0, both teams contribute to the clean-sheet total. A baseball game usually ends with one winner and one loser, and a shutout belongs to the side that prevented all opposing runs.
The fairest question is therefore not which sport owns the most impressive-looking zero. It is how unusual that outcome was among comparable contests, against comparable opposition, under the same rules.
Tennis and the difficulty of winning every game
A tennis bagel requires six games without interruption by an opponent’s successful game. That normally means protecting three service games and breaking serve three times. Even when one player is much stronger overall, the weaker player has repeated opportunities to change the pattern with a short run of good serves, an aggressive return game or a few errors from the favourite.
The scoring structure offers recovery within games. A player can fall behind 0–40, reach deuce and eventually hold serve. The player delivering the bagel must close those doors. Six games won comfortably and six games won through repeated deuce battles produce the same set score, but they tell different stories about control.
A double bagel, 6–0, 6–0, extends that pressure across an entire completed best-of-three-set singles match. A triple bagel does so over three sets in a best-of-five contest. Neither should be confused with a retirement or a walkover. An unfinished match with zeros in the score is not the same achievement as completing every required game.
Graf and a Grand Slam final without a game conceded
One of the defining examples came in the 1988 French Open final. Steffi Graf defeated Natasha Zvereva 6–0, 6–0. A Grand Slam final ordinarily brings together two players who have survived six rounds of difficult opposition. Producing a double bagel at that stage made the result far more striking than the same score against a greatly overmatched early-round opponent. [4]
The score also demonstrates why context is part of difficulty. The label “final” does not guarantee a close contest, but it describes the route both players took to get there. Graf had to maintain her standard on a major stage while Zvereva repeatedly had chances to win a game. The final score preserves the outcome without explaining every point that created it.
It is tempting to read a double bagel as a complete statement about the losing player’s ability. That is unfair. A single match reflects a particular surface, matchup, tactical problem and day. Reaching a major final is itself evidence of a level far beyond what the zeros might suggest to someone seeing only the result.
Swiatek and the modern double bagel
Iga Swiatek supplied a more recent example at Roland Garros in 2024, beating Anastasia Potapova 6–0, 6–0 in 40 minutes. Swiatek won 48 of the match’s 58 points. Potapova won ten points, which is a useful correction to the idea that she scored literally nothing. She simply never assembled enough points in one game to put a game on the scoreboard. [5]
Swiatek’s result illustrates how sustained pressure can operate on both serve and return. A bagel cannot normally be built through serving alone. The player must also dismantle the opponent’s service games, preventing the usual breathing space that a good first serve can provide.
Her example is evidence of an exceptional player’s capacity for overwhelming wins. It does not establish that bagels have become more common across women’s tennis. That larger claim would require a consistent set-by-set database, a defined period and adjustments for match level, surfaces and tournament formats. A handful of dramatic scorelines is not a tour-wide trend.
The golden set is a different level of perfection
A golden set requires winning all 24 points needed for a 6–0 set. The distinction is enormous. A conventional bagel can include lost points and long games. A golden set permits none of that: six games, each won to love.
At Wimbledon in 2012, Yaroslava Shvedova won the opening set against Sara Errani without dropping a point, then completed a 6–0, 6–4 victory. Bill Scanlon had produced another documented golden set against Marcos Hocevar in 1983, winning their match 6–2, 6–0. These examples belong in a separate category from the far broader history of bagels. [6, 7]
They also expose an interesting feature of tennis. Even a perfect set does not complete the match. The scoreboard resets at the start of the next set, giving the opponent a new route back into the contest. A player can lose a bagel set and still win the match. In hockey or baseball, a conceded goal or run cannot be erased from the final total in that way.
The psychological task is therefore two-sided. The dominant player must keep playing with purpose after an unusually easy set. The opponent must resist treating the previous six games as a prediction of the next six. Tennis provides unusually visible proof that a zero can describe a passage of play without defining the whole contest.
Hockey and the goalkeeper who cannot make one costly mistake
Hockey places a recognisable individual at the centre of the shutout: the goalie. The position invites a simple story about one athlete stopping everything. The actual work involves the entire team. Defencemen clear rebounds, forwards track back, penalty killers close passing lanes and players block shots before they reach the net.
Even then, the goalkeeper must respond to deflections, screens, loose pucks and plays that change direction almost instantly. A shot that seems manageable before traffic intervenes can become a goal. A shutout can disappear through an accidental bounce after almost an entire game of excellent work.
That fragility makes the final minutes distinctive. The losing team may take greater attacking risks, including removing its goalie for an extra skater. The defending side has more reason to protect the middle of the ice, but it still needs a way to clear the puck and avoid becoming trapped. The zero becomes a tactical problem shared by every player on the ice.
Brodeur and the value of an entire career
Martin Brodeur finished with 125 NHL regular-season shutouts and 24 more in the playoffs. His regular-season total is the career benchmark, while the playoff figure belongs to a separate record category. Adding them produces 149, but reporting that number without explaining the combination would confuse two different competitions. [8, 9]
The NHL’s Hall of Fame material lists 1,266 regular-season appearances for Brodeur. His 125 shutouts are equivalent to about one for every ten appearances, a calculation that gives the huge career number some scale. It is an appearance-based comparison, not a shutout rate per start, and relief appearances complicate its interpretation. [8]
Brodeur’s record required more than occasional brilliance. He needed years of health, selection and effective play, plus teams capable of defending around him. New Jersey’s contribution does not diminish the goalie’s achievement. It explains why such records sit at the intersection of individual ability and a lasting defensive system.
The postseason adds another level of pressure. Brodeur recorded seven shutouts during New Jersey’s 2003 Stanley Cup run. Repeatedly denying playoff opponents is different from collecting isolated zeros across a long regular season: the opposition is strong, preparation is detailed and familiar opponents can adjust from one game to the next. [10]
Hainsworth and an era that produced different numbers
George Hainsworth’s 1928–29 season remains an extraordinary historical benchmark: 22 shutouts in 44 games for the Montreal Canadiens. That is exactly half the schedule. It is both a remarkable individual season and a reminder that league conditions shape the record book. [11]
The NHL averaged approximately 1.46 goals per team per game that season. The corresponding figures were 2.57 in 2003–04 and 3.11 in 2023–24. Those selected seasons are not a continuous trend line, but they show why a shutout total from the late 1920s cannot be interpreted as though it occurred in a recent scoring environment. [12]
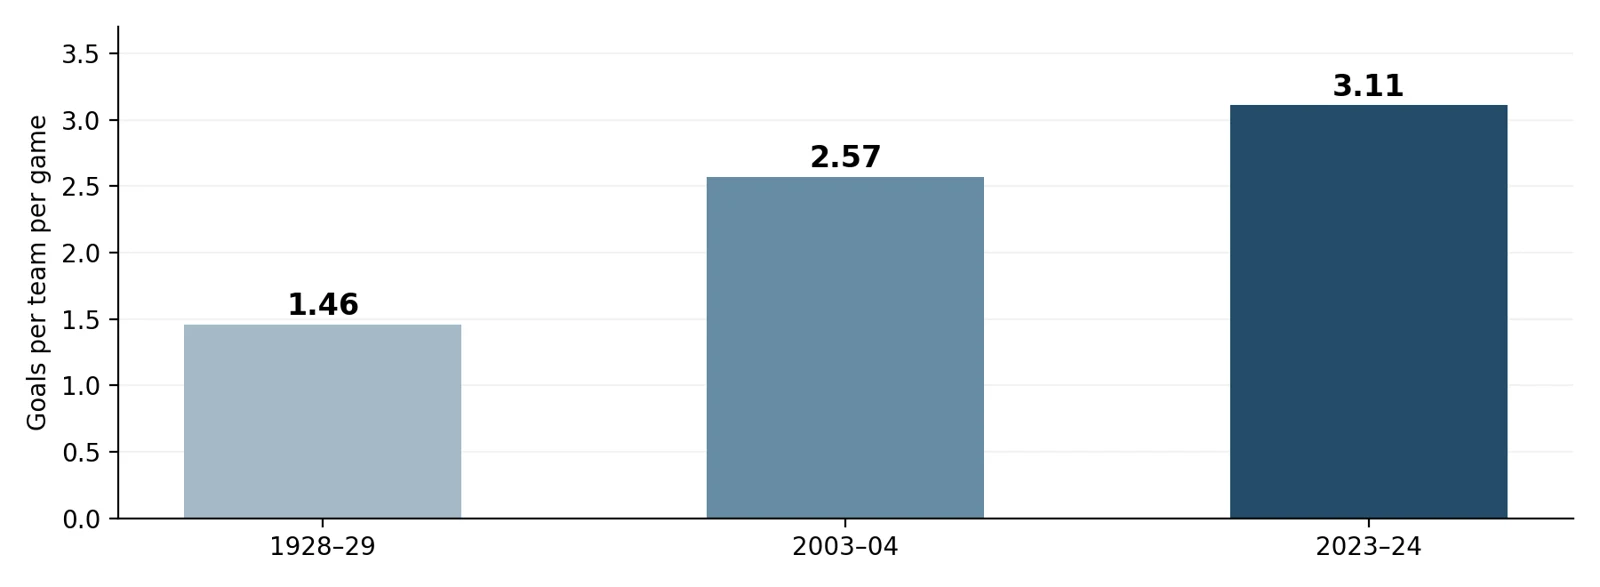
Selected NHL scoring environments. These are historical snapshots, not a continuous trend or measured shutout rates. Source Hockey Reference. [12]
More goals per team generally leave less room for zeros, although an average alone cannot determine the exact shutout rate. A league could distribute the same total goals through many close games or through a mixture of blowouts and low-scoring contests. To measure the change precisely, we would need the game-by-game score distribution.
Tony Esposito’s 15 shutouts for Chicago in 1969–70 offer another major season landmark from a later era. [13]
Alec Connell’s NHL record sequence of 460 minutes and 49 seconds without conceding, achieved with Ottawa in 1927–28, measures a different form of persistence. A season total can survive an occasional poor night. A streak cannot: the next goal ends the accumulation immediately. [14]
Why team and goalie records can separate
A team can use more than one goalie while conceding no goals. That does not automatically give either goalie an individual shutout. Conversely, a shootout can settle a modern game after both goalies have preserved zeros during regulation and overtime.
A January 2025 Rangers–Blue Jackets game ended 1–0 after a shootout while both starting goalies received shutouts. [15]
This is why record tables should specify whether they cover regular-season play, playoffs, team shutouts, individual credit or shootout results. The apparent contradiction disappears once the category is clear. A goalie can have prevented every goal that counts against the playing-time record and still watch the opponent celebrate the final result.
Soccer and the collective achievement of a clean sheet
Soccer makes zero a familiar possibility without making it easy. A single goal can decide a match, and a team does not need constant attacking success to destroy a clean sheet. One penalty, a free kick, a corner or a counterattack can be enough.
Defensive work also begins far from the goalkeeper. A forward who pressures a defender can prevent a dangerous pass. A midfielder who tracks a runner can stop the final ball from being delivered. A defender who protects space may contribute more than one who repeatedly makes spectacular emergency tackles. The goalkeeper completes the structure rather than creating it alone.
Possession can help protect a clean sheet by keeping the opponent away from the ball, but possession without secure positioning can leave a team vulnerable when it loses it. A side defending deep may concede territory while protecting the most dangerous areas. Different styles can therefore reach the same statistical destination.
Cech and Chelsea have related but different records
Petr Cech’s 202 Premier League clean sheets are the competition’s career benchmark. His 24 clean sheets in 35 appearances during 2004–05 are also the individual single-season record. Those achievements describe one goalkeeper’s credited performances in one league, rather than all of his football across every competition. [16]
Chelsea’s team total that season was 25 clean sheets in 38 league matches. The club conceded only 15 league goals. The difference between Cech’s 24 and Chelsea’s 25 is not a statistical error: the team and the individual did not have identical appearance records. [17]
The team figure means Chelsea finished about 65.8 percent of its league matches without conceding, calculated from 25 divided by 38. That is a much more informative measure than simply saying the defence was excellent. It describes how often opponents were denied even one goal across an entire title-winning campaign.
Yet the percentage should still be read in context. Chelsea’s opponents, tactics, squad and schedule belong to a particular season. Comparing that rate with a national team’s record against a varied international schedule would not isolate goalkeeper quality. A clean-sheet percentage answers a defined question, not every question about defending.
Manchester United and the difference between minutes and matches
Manchester United recorded 14 consecutive Premier League team clean sheets during 2008–09. Edwin van der Sar’s individual league sequence without conceding reached 1,311 minutes. These related records are often treated as interchangeable, but they are not the same statistic. [17, 18]
A team streak follows the club, regardless of which goalkeeper plays. A goalkeeper’s minutes follow that individual’s appearances. Changing the goalkeeper can therefore separate the two timelines. The distinction is especially important when a team concedes in a match the record-setting goalkeeper did not play.
Minutes also provide a more precise measure than a rounded count of matches. A goalkeeper can concede late in one match, keep several complete clean sheets and then concede early in another. The scoreless sequence begins and ends inside games, rather than at the convenient boundaries used by a simple match total.
Hope Solo and the international record
Hope Solo finished her United States career with 102 shutouts in 202 appearances, according to U.S. Soccer. That is approximately 50.5 percent of her appearances. The total gives women’s international soccer an essential place in any discussion of outstanding goalkeeping careers. [19]
The record also illustrates why competition scope must travel with the number. International teams face tournament matches, qualifying games and friendlies, with differing opposition and stakes. Club seasons involve a different rhythm and a different distribution of opponents. Solo’s national-team total and Cech’s Premier League total are each meaningful without pretending they are directly interchangeable.
For supporters, the emotional value can be similar. A goalkeeper protects a narrow lead while the match changes around her. One defensive intervention or one controlled catch can matter more than a long period of apparent calm. A clean sheet rewards the whole sequence of decisions, including many that never become highlights.
More goals can change the clean sheet landscape
The 2023–24 Premier League produced 1,246 goals in 380 matches, approximately 3.28 per match. That was a marked increase from roughly 2.85 the preceding season. It supplies a useful recent example of a competition becoming more productive offensively. [20]
The direction of the pressure is clear: a higher-scoring environment challenges teams trying to preserve zeros. The exact size of the effect needs separate clean-sheet counts. Changes in added time, tactical risk, finishing and match circumstances can all be investigated, but one season’s goals total cannot prove which factor caused the increase.
The distinction between “goals per match” here and “goals per team per game” in the hockey comparison is deliberate. Soccer’s 3.28 describes both teams combined. Hockey’s 3.11 describes one team. Putting the two numbers beside each other without their units would create a misleading comparison.
Baseball and the changing ownership of the shutout
Baseball gives the offence repeated chances without providing a clock for the defence to run down. In a standard nine-inning game, a winning home team normally needs 27 defensive outs. A pitcher protecting a shutout cannot simply hold the ball until time expires. The next batter still has an opportunity to reach base, and a single swing can change everything.
A shutout is also distinct from the better-known no-hitter. Hits can be scattered harmlessly across innings in a shutout. A no-hitter can include walks, errors and even runs. A perfect game, which allows no opposing batter to reach base, imposes a more demanding standard again.
The pitcher’s role makes the statistic look individual, but the catcher calls and receives pitches, fielders convert balls in play into outs and positioning affects what becomes a hit. A difficult defensive play can protect a shutout as decisively as a strikeout. The score records the run prevention without assigning every contribution.
Walter Johnson and a career record from another workload
Walter Johnson’s 110 career shutouts remain the major-league benchmark. The Baseball Hall of Fame also credits him with 531 complete games. Those numbers belong together because the individual shutout requires the pitcher to complete the game while allowing no runs. [21]
The modern obstacle is therefore partly structural. A pitcher might throw six brilliant scoreless innings and leave with his team ahead. If relievers complete the job, the team has a shutout, but the starter does not receive an individual shutout. Replacing him may be sound strategy even though it ends his chance to enter that particular statistical column.
Johnson’s record is difficult to approach because a challenger needs both the ability to prevent runs and repeated permission to finish games. Talent alone does not supply the opportunity. Changes in pitch management and bullpen use make the historical path less available, quite apart from the quality of opposing hitters.
The single-season individual record is 16 shutouts, shared by George Bradley in 1876 and Pete Alexander in 1916. Bradley’s season came with an immense workload by modern standards, a reminder that early professional baseball cannot be understood through current pitching expectations. [22, 23]
Team zeros and individual zeros tell different stories
The 1906 Chicago White Sox recorded 32 team shutouts, a striking franchise season benchmark. [24]
That team total should not be confused with one pitcher’s season. It can include the work of several starters and, where applicable, combined efforts. A club’s ability to keep opponents scoreless depends on the entire pitching staff and defence, so the team record can remain relevant even as the individual complete game becomes unusual.
Bob Gibson’s 1968 season offers another extraordinary individual reference point. He recorded 13 shutouts and a 1.12 earned run average. The season became one of baseball’s defining demonstrations of pitching dominance. [25]
For a recent comparison, 16 pitchers finished tied for the 2024 major-league lead with one individual shutout apiece. In other words, the whole league produced 16 individual complete-game shutouts that season, equal to the single-pitcher season record from Bradley and Alexander. The comparison is a historical snapshot, not a claim that 2024 represents every subsequent season. [26]
The contrast is dramatic, but it must be interpreted correctly. It does not mean modern teams collectively managed only 16 scoreless games. Combined shutouts are a separate category. Nor does it demonstrate that present-day pitchers are less capable. It shows that the statistical route through an entire game has become much less common.
Hershiser and the innings that kept accumulating
Orel Hershiser’s 59 consecutive scoreless innings in 1988 provide baseball’s classic example of a streak measured across games. Unlike a single shutout, the achievement carries the pressure from one appearance into the next. The sequence is a regular-season record; mixing postseason innings into the same total would change the category. [27]
A scoreless-innings streak can include situations that never appear in the final line as runs allowed: runners left on base, an escape from a difficult inning, a crucial defensive play. Each new inning creates another opportunity for the opponent and another chance for the pitcher’s control to slip.
There is an important managerial tension here. A coach may be tempted to preserve a starter’s personal milestone, but the team’s best chance of winning can involve using a fresh reliever. The record book rewards completion, while competitive strategy rewards the best decision in the moment. Those goals can align, but they do not always do so.
Why the modern trend needs two separate charts
A proper history of baseball shutouts would plot individual pitcher shutouts and team shutouts separately. The first chart would capture changing starter workloads and complete-game usage. The second would capture how often the opposing lineup actually finished with no runs.
Combining them into one trend obscures the sport’s evolution. A bullpen can distribute the responsibility for a zero among four pitchers without making the zero any less real for the team. The achievement has changed ownership as much as it has changed frequency.
Football and the difficulty of denying every kind of score
Football makes the shutout a team-wide project because points can come from several units. Preventing offensive touchdowns is not enough. Field goals, safeties, interception returns, fumble returns and kick returns can all break the zero. A defence may play superbly while a mistake elsewhere prevents the team from recording a shutout.
Field position changes the problem. An offence that repeatedly gives the ball away near its own goal line forces its defence to protect against immediate scoring chances. An offence that sustains possession can help the defence by reducing the opponent’s opportunities. The official zero therefore reflects interactions among offence, defence and special teams.
The clock creates another dimension. A team with the lead can shorten the remaining contest through possession and careful play. Yet a late turnover can give the opponent a short route to points. A shutout is not secure simply because the outcome of the game appears settled.
Early NFL teams and exceptional seasons
The 1927 New York Giants produced ten shutouts during a 13-game season and allowed only 20 points in total. The figures describe a defensive environment dramatically different from modern professional football, but they remain a remarkable account of sustained denial. [28]
Green Bay’s 1929 championship team recorded eight shutouts in 13 games, including a 0–0 tie. The Packers finished 12–0–1 and conceded only 22 points. The tie matters: keeping an opponent scoreless is not automatically the same as winning. [29]
These seasons resist direct comparison with a modern 17-game NFL schedule. Passing rules, offensive methods, kicking, equipment, competition and the structure of the league have changed. A longer schedule offers more possible shutouts, but it also asks players to sustain form and availability for longer. Raw totals conceal both effects.
The 1940 NFL championship supplies the most famous combination of a huge winning score and a zero: Chicago defeated Washington 73–0. The losing zero would have been the same in a 3–0 game; the 73 describes an additional offensive collapse and domination beyond the shutout itself. [30]
The Super Bowl has resisted the zero
No team has been shut out in the Super Bowl through Super Bowl LX in February 2026. The familiar example of a dominant defensive championship performance is New England’s 13–3 victory over the Los Angeles Rams in Super Bowl LIII. Three points were enough to prevent a shutout, however thoroughly the defence controlled the evening. [31, 32]
This is a useful corrective to the idea that a shutout is the only proof of elite defending. A championship defence can deliver the decisive performance of a season while allowing a field goal. The difference between zero and three is statistically absolute, but it may say less about overall quality than the score alone suggests.
Canadian football adds the single point
Canadian football includes the rouge, or single point, as a scoring category. That gives the scoreboard another route away from zero, although the circumstances governing singles depend on the applicable rules. The existence of that scoring option is one reason a CFL shutout should be discussed in its own setting. [33]
Toronto’s 13–0 victory over Winnipeg in the 1950 Grey Cup provides a historical championship example. Decades later, Edmonton’s 24–0 win over Saskatchewan in 2014 ended a 514-game stretch in which the Roughriders had avoided being shut out. That long sequence illustrates how a franchise can lose games, sometimes badly, while still usually finding at least one way to score. [34, 35]
For Canadian fans, the distinction is familiar. A missed opportunity does not always leave the score unchanged, and the tactical choices around kicking can matter late in a game. Comparing CFL and NFL shutouts requires attention to those rules rather than treating the two codes as one statistical competition.
Basketball and the answer to the shutout question
Basketball’s repeated possessions and multiple scoring routes make a full-game zero extraordinarily difficult to sustain between reasonably matched teams. A player can score through a layup, an outside shot, an offensive rebound or a free throw. A defence must keep every one of those possibilities from producing even a single point.
The basket is also available throughout the game. A team that falls far behind continues to receive possessions. There is no equivalent of a tennis set ending after six lost games, and no goalkeeper who can personally intercept every scoring attempt. Once a foul creates free throws, the defence may have no active play left to make against the shot itself.
The NBA low was still 18 points
On November 22, 1950, Fort Wayne defeated Minneapolis 19–18. The game came before the NBA introduced the shot clock, when deliberate possession could drastically restrict the number of attempts. Its losing total remains the NBA’s historical low, rather than a zero. [2]
In the shot-clock era, Chicago scored 49 points against Miami on April 10, 1999, losing 82–49. [36]
The shot clock limits how long an offence can hold the ball without attempting a qualifying shot. It does not guarantee scoring, but it prevents a leading team from spending the whole contest simply retaining possession. The NBA introduced it for the 1954–55 season, helping create a very different offensive environment from the 19–18 game. [37]
A scoreless quarter is a much narrower proposition than a scoreless game. Reports about a zero in one period should never be promoted into a full-game shutout. The same caution applies to forfeits: an administratively awarded score does not describe a team being prevented from scoring during normal play.
The school game that ended 100–0
The January 2009 game between The Covenant School and Dallas Academy is a documented answer to the broader question. Covenant’s reported on-court winning score was 100–0. Subsequent coverage described the school’s regret and the dismissal of its coach after he declined to apologise. [1, 38]
The episode is best understood as a warning about mismatched competition and adult responsibility. It does not show that elite basketball teams are approaching shutouts, and it should not turn the losing children into a sporting curiosity. The competitive and ethical circumstances matter more than celebrating the numerical extreme.
So the answer has two parts: basketball shutouts have occurred in documented school competition, while the NBA has never had one. Mixing those levels would produce a dramatic headline at the cost of an accurate comparison.
The records that put zero in perspective
| Competition and category | Athlete or team | Benchmark |
|---|---|---|
| French Open final in 1988 | Steffi Graf | Won 6–0, 6–0 against Natasha Zvereva [4] |
| Wimbledon golden set in 2012 | Yaroslava Shvedova | Won all 24 points in the opening set [6] |
| NHL regular-season career | Martin Brodeur | 125 individual shutouts [8] |
| NHL season in 1928–29 | George Hainsworth | 22 shutouts in 44 games [11] |
| Premier League career | Petr Cech | 202 clean sheets [16] |
| Premier League team season | Chelsea in 2004–05 | 25 clean sheets in 38 matches [17] |
| United States women internationally | Hope Solo | 102 shutouts in 202 appearances [19] |
| MLB pitcher career | Walter Johnson | 110 individual shutouts [21] |
| MLB pitcher season | Bradley and Alexander | 16 individual shutouts each [22, 23] |
| NFL historical season | Giants in 1927 | Ten shutouts in 13 games [28] |
| NBA full-game scoring low | Minneapolis in 1950 | 18 points in a 19–18 defeat [2] |
What is changing and what the numbers cannot tell us
There is no single trend sweeping through every sport. Baseball’s use of pitching staffs changes who receives the credit. Hockey’s historical scoring environments change the background probability of a zero. Soccer can experience a high-scoring season while still producing remarkable defensive teams. Tennis can produce a player who repeatedly overwhelms opponents without proving that the entire tour has become less competitive.
The rules can also move the target. A shot clock changes the number of basketball possessions available. Shootouts change how hockey selects a winner without necessarily changing individual goalie shutout credit. Football’s scoring categories differ between codes. A historical comparison that ignores these changes can give precision to the wrong question.
To measure trends properly, researchers should use completed contests, specify the competition and count the opportunities consistently. Tennis might use bagel sets divided by completed sets. Soccer might use team clean sheets divided by team matches. Baseball should report team and individual shutouts separately. Hockey needs a clear treatment of overtime, shootouts and shared goaltending.
Opponent quality belongs in the interpretation as well. Holding a title contender scoreless is different from shutting out an inexperienced team, even when the record book gives both one entry. A playoff clean sheet may have greater competitive importance than a routine regular-season one, but that does not make it mathematically equivalent to several ordinary shutouts.
The best records survive careful description. Brodeur’s career total does not need to be confused with his playoff total to impress. Chelsea’s team record does not need to be assigned entirely to Cech. Johnson’s workload can be acknowledged without dismissing modern pitchers. Graf’s final can be celebrated without pretending Zvereva never won a point.
What spectators can watch for
A shutout becomes easier to appreciate when the viewer looks beyond the final intervention. In hockey, watch whether attackers can reach rebounds and whether defenders keep the goalie’s sightline clear. In soccer, notice how often the opposition receives the ball facing goal rather than with its back to it. Those details help distinguish a goalkeeper carrying a defence from a defence limiting the goalkeeper’s workload.
In baseball, follow the runners and the outs rather than the hit total alone. Several harmless singles spread across nine innings can be less threatening than one walk followed by an extra-base hit. In football, the starting position of each possession helps explain why one defence faces repeated scoring emergencies while another has room to recover from a short gain.
Tennis asks the spectator to examine the games inside the set. Did the player facing a bagel repeatedly reach deuce? Were there break points that could have changed the score? A 6–0 set can be closer in individual contests than a 6–3 set filled with comfortable holds and one decisive break.
These observations do not replace the record book. They make its numbers more useful. The zero tells us that the opponent never crossed the required scoring threshold; the play tells us how close that opponent came, how much control the winner exercised and what kind of effort will be required to repeat it.
The final minutes and the last chance
The hardest part of protecting zero is often accepting that the next play still matters. A goalkeeper cannot rely on the saves already made. A pitcher cannot spend yesterday’s scoreless innings to retire today’s hitter. A tennis player cannot turn five games of dominance into the sixth without playing the points.
For the opponent, that creates a small but persistent source of hope. One successful possession can rescue something from an otherwise difficult afternoon. One hold of serve can change the feeling of a match. One late goal can end a celebrated streak even when it cannot change the winner.
That is why shutouts and bagels attract attention beyond the margin of victory. They record an opponent repeatedly trying to find an opening and failing to make the particular breakthrough the sport requires. Some are built through overwhelming control; others survive on a last save, a fortunate bounce or an exceptional play behind the pitcher.
The zeros look identical from a distance. Their histories are anything but identical. The pleasure of studying them lies in discovering how much work, context and sometimes good fortune sit behind a scoreboard that appears to say nothing happened.
Sources
- [1] FIBA 2009 report on the Covenant School and Dallas Academy game
- [2] NBA official 1954 record book and historical scoring records
- [3] ABC News contemporary reporting on the January 2009 school game
- [4] Roland Garros official history of the 1988 tournament
- [5] WTA on Swiatek versus Potapova at Roland Garros in 2024
- [6] WTA on Shvedova and the Wimbledon golden set
- [7] Guinness World Records on the golden set and Bill Scanlon
- [8] NHL Hall of Fame class of 2018 official statistical profile
- [9] Guinness World Records on Brodeur regular season and playoff shutouts
- [10] New Jersey Hall of Fame profile of Martin Brodeur
- [11] Ontario Sports Hall of Fame profile of George Hainsworth
- [12] Hockey Reference NHL league averages by season
- [13] NHL historical profile of Tony Esposito
- [14] NHL official records for longest goalie shutout sequence
- [15] NHL recap of Rangers versus Blue Jackets on January 18 2025
- [16] Premier League on Petr Cech clean sheet records
- [17] Premier League historical records reviewed in February 2026
- [18] Guinness World Records on Van der Sar and 1311 minutes
- [19] US Soccer Hope Solo by the numbers
- [20] Premier League statistical review of the 2023 to 2024 season
- [21] National Baseball Hall of Fame profile of Walter Johnson
- [22] SABR biography of George Bradley and his 1876 workload
- [23] Baseball Reference single season shutout leaders
- [24] Chicago White Sox official season records
- [25] National Baseball Hall of Fame profile of Bob Gibson
- [26] StatMuse complete game shutouts thrown in 2024
- [27] SABR on Hershiser completing his 59 inning scoreless streak
- [28] New York Giants historical team photographs and 1927 season summary
- [29] Green Bay Packers retrospective on the 1929 season
- [30] Pro Football Reference 73 to 0 professional football game record
- [31] Sports Illustrated review of Super Bowl shutout history
- [32] Seattle Seahawks official report of the Super Bowl LX result
- [33] CFL rulebook scoring definitions historical 2025 edition
- [34] Canadian Football Hall of Fame Grey Cup winners and scores
- [35] CFL retrospective on Saskatchewan being shut out in 2014
- [36] NBA historical dates in April and the Bulls 49 point game
- [37] WBUR history of the introduction of the NBA shot clock
- [38] Associated Press report on the dismissal of Covenant coach